People living alone rises as couples living together decrease: Census data

The number of people living alone in the U.S. is on the incline while couples living together are decreasing, per newly released 2020 U.S. Census Bureau data.
Why it matters: The decennial census figures show the changing trends in demographics and housing for American families.
Driving the news: One-person households increased to about 28% of all U.S. households in 2020.
- That's up from 25% in 1990 and 7.7% in 1940.
- That means 0ver a quarter of occupied U.S. households in 2020 consisted of one person living alone.
- The share of "nonfamily households" — those in which someone lives alone or no one related to the householder is present — increased by 12%.
Zoom out: Families remained the largest type of U.S. households, with the majority consisting of married couples.
- About two-thirds of all households were family households, the same share as a decade earlier.
- Married-couple households accounted for about 71% of them.
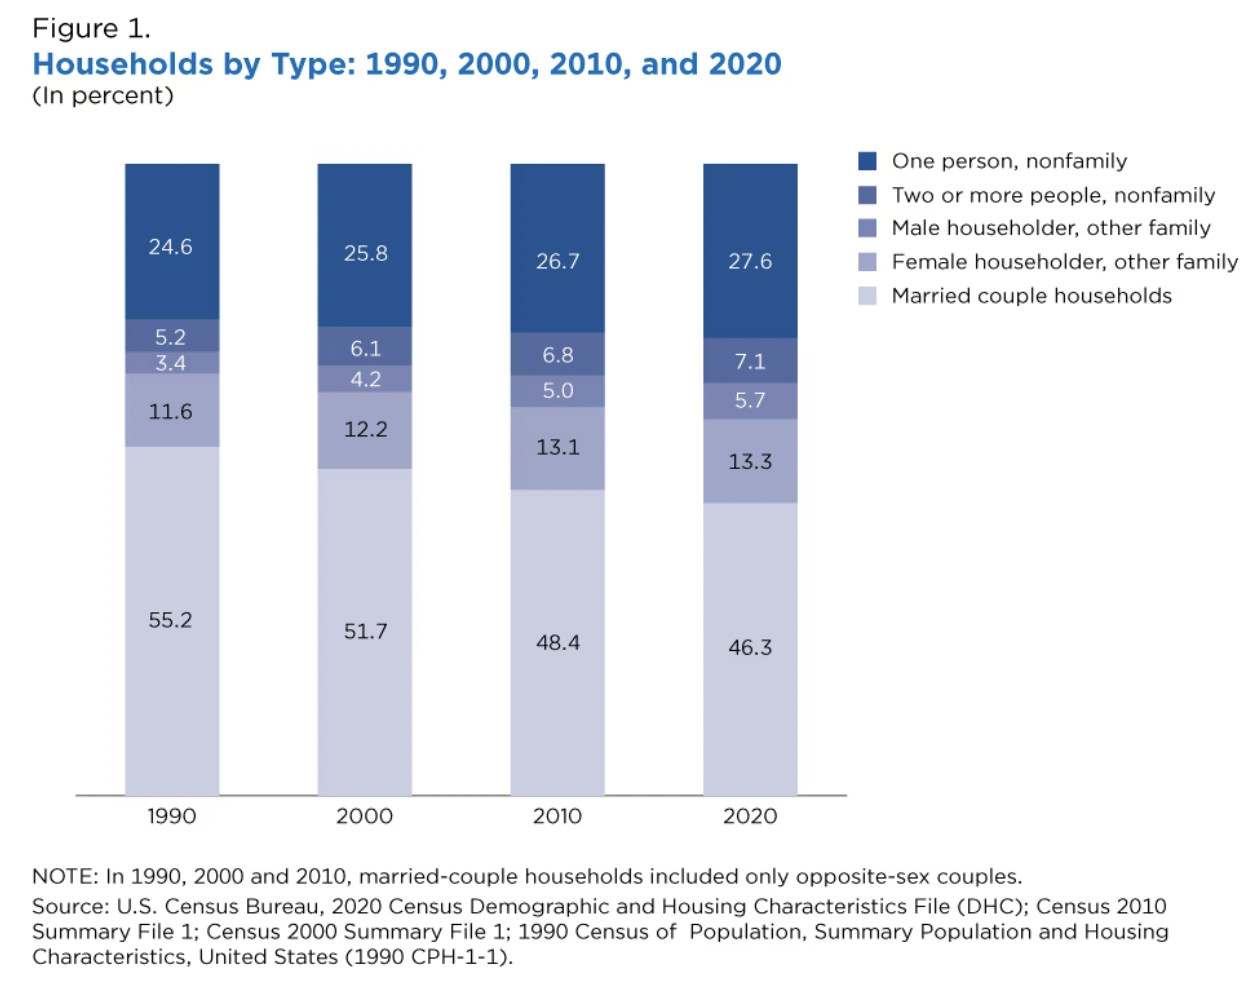
Yes, but while coupled households are still the most common, their share declined to 53.2% in 2020 – down from 55.1% in 2010 and 56.9% in 2000.
- Coupled households are when the householder lives with a spouse or partner.
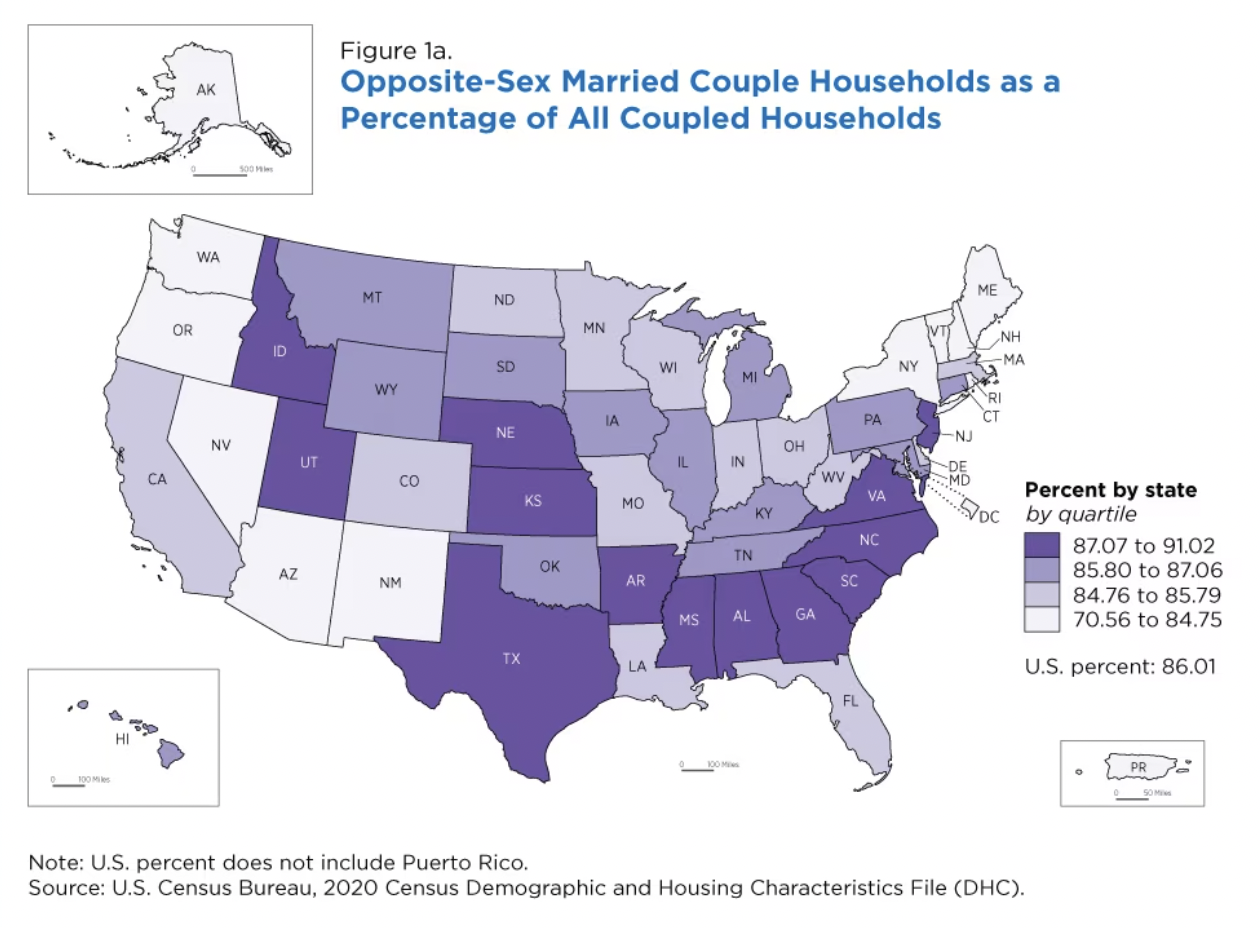
- The majority of such households were opposite-sex married couples (45.7%), followed by opposite-sex unmarried (6.5%), same-sex married (0.5%) and same-sex unmarried (0.4%).
- The highest percentage of coupled households of all types were in the West, while the most opposite-sex married couples were concentrated in the southern U.S.
- The South also has the lowest share of opposite-sex unmarried couples living together.
Of note: The number of female householders (35.5 million) with no spouse or partner present was higher than that of males (23.9 million).
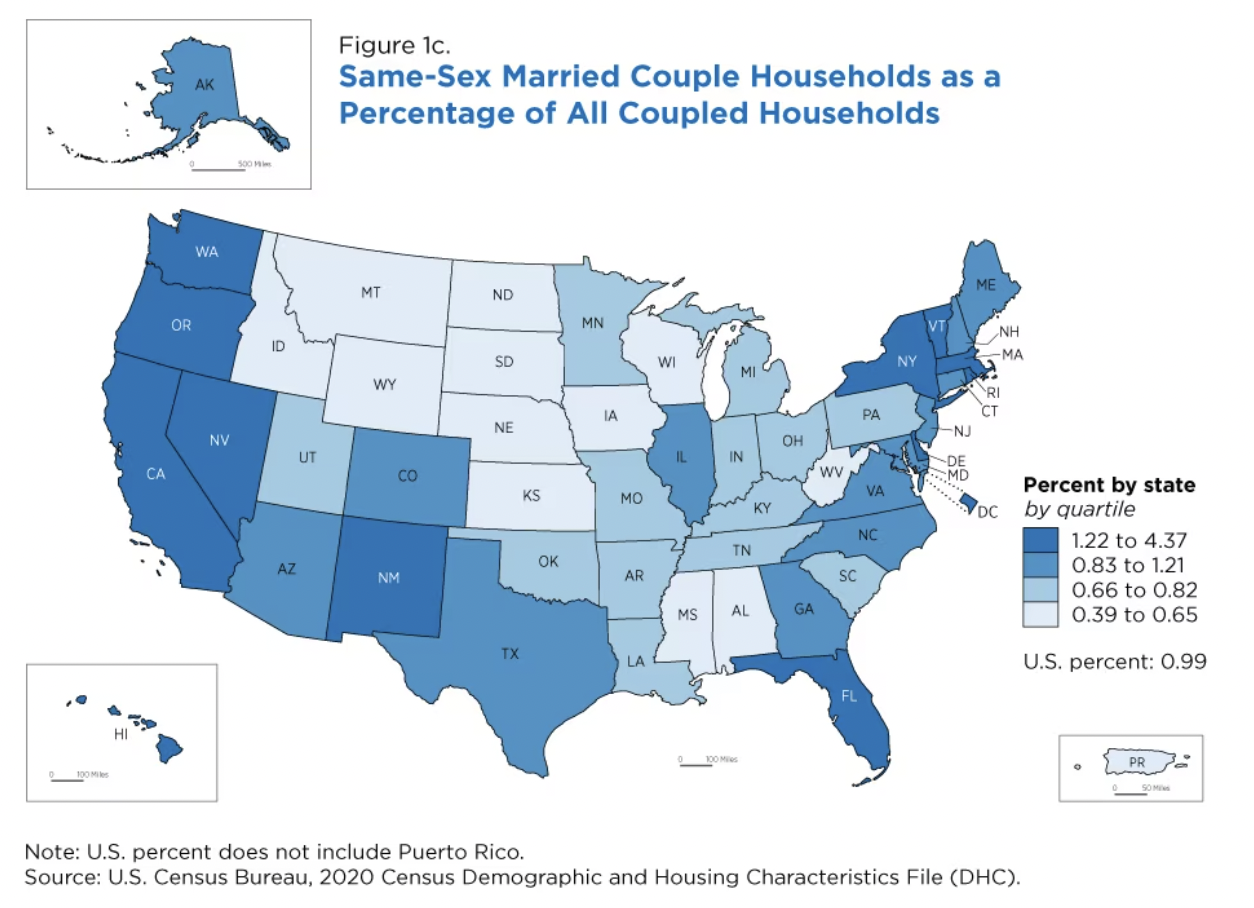
Same-sex couple households
Same-sex couples made up about 1% of U.S. households in 2020, per the newly released U.S. Census Bureau data.
By the numbers: Married same-sex couples made up 0.5% of 127 million U.S. households, while unmarried ones made up nearly 0.4%, totaling about 1.2 million same-sex households, survey results show.
- That's up from 980,000 same-sex couple households in 2019.
- The states with the highest concentrations of same-sex married couples were along the West Coast and in the Northeast, plus Delaware, the District of Columbia, Florida, Hawaii and New Mexico, per the Census.
Context: It's the first time the decennial census has shown distinct totals of opposite-sex and same-sex spouse and unmarried partner households.
- Previous censuses have had limited data on same-sex couples and the latest is the most comprehensive set of information for the U.S. yet.
- The data doesn’t include information on single or transgender people, meaning it covers less than a fifth of the LGBT population, Kerith Conron, research director at the UCLA School of Law’s Williams Institute, told the Wall Street Journal.