How to understand the worst-ever U.S. jobless report
Published Date: 3/26/2020
Source: axios.com
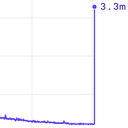
Source: St. Louis Fed; Chart: Axios VisualsIt's the most stunning chart of this crisis yet — the number of people filing for unemployment spiked to 3.3 million last week, a number unprecedented in U.S. history. Why it matters: This is a picture of what happens when a huge swath of the economy comes to a very sudden stop. But it tells us very little about how bad this recession is turning out to be. We're not going to get useful data on that for another month or so.The big picture: In a recession, millions of people become unemployed. But in a normal recession, that process can take months or even years. This time around, the layoffs are being squeezed into a matter of weeks. By the numbers: If unemployment claims continue at this pace for another four weeks, we'll end up seeing half as many workers laid off as lost their jobs during the 2008–09 Great Recession. On the other hand, if these numbers continue for 16 weeks, it will be twice as bad. The only way to tell which way we're going is to wait and see. The March jobs report, out on April 3, reports on employment from the second week of March — too early to reflect the impact of the coronavirus shutdown. The first post-crisis jobs report will be the April one, out on May 8. What they're saying: In this recession, "It's like an umpire whistled all the players off the economic playing field," University of Michigan economics professor Justin Wolfers tells Axios. In order to get the much-coveted V-shaped recovery, he adds, "they need to be able to whistle us back on."The bottom line: In order for government officials to be able to persuade Americans to go back to normal, we have to be able to trust them when they tell us that it is safe to do so.